|
Curvature Driven Kinetics |
In the following a proof is given that the Monte Carlo simulation follows a curvature driven kinetics.
 
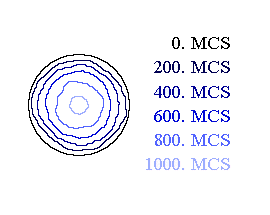
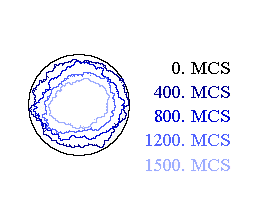
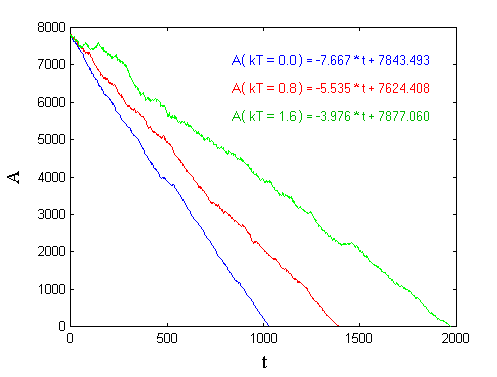
Figure 1: Monte Carlo simulation of a circular grain including specification of Monte Carlo time steps (left: low simulation temperature; right: high simulation temperature). Therefore, the simulation has been performed with circular grains at different simulation temperatures. Figure 1 shows different states of the simulation. Both - the shrinking and the irregularity in the shrinking of the area of the circles - are clearly visible. The temporal development of the area A of the circles in dependence of the temperature T is shown in Figure 2. The linear Relationship between the areas A and the time t are in excellent agreement with the theoretical prediction. 
Figure 2: Shrinking of the areas A of the circles depending on time t and temperature T. Grain coarsening means the temporal decrease of the totel inner interface of a grain structure. The driving force of this decrease is the grainboundary curvature K. Therefore, it is also called curvature driven kinetics. Now let us consider K as the sum over all main curvatures of a part of the interface, and a kinetic constant k as the product of grain boundary mobility and grain boundary energy. The velocity of this part can be calculated as  . .
| (1) |
The velocity vector is always perpendicular to the boundary. In Figure 3 a possible temporal development of such a motion is sketched. The velocity vectors are denoted. The black line shows the initial state, whereas the grey line shows a possible boundary change.

Figure 3: Scheme of a possible grain boundary motion. The temporal change of an area A enclosed by a smooth/plane grain boundary of length U can be calculated as [Mullins 1956]:  , ,
| (2) |
where ds is a differentiell element of the bend length s. Together with (1): . .
| (3) |
For an enclosed plane curve the proposition for the totoal curvature gives [Mullins 1956]: . .
| (4) |
Therefore, or  . .
| (5) |
Independend of the form of the curves the enclosed area will always decrease linearly with time. Especially, for a circle is , ,and therewith  , ,following to  . .The integration yields 
| (6) |
with  as the initial radius. The above relation follows furthermore from the equation of motion for the curve length U as the initial radius. The above relation follows furthermore from the equation of motion for the curve length U
| (7) |
which takes together with (1) the form . .
| (8) |
|
While Eq. (8) cannot be integrated analytically for a random plane curve, for the special case of a circle with  , ,  one yields  , ,
| (9) |
or , ,
| (10) |
|
leeding to Eq. (6). Therefore, the radius R and the curve length U both decrease parabolically with time t for a circle :  , ,
| (11) |
 . .
| (12) |
|
For any plane enclosed curves - like for example fractal or very rough grains - the enclosed area still decreases with time t according to Eq. (5). However, the parabolic time law (12) for the curve length U is no longer valid. It is to be expected that the time law for the decrease of the curve length is determined by the geometrical properties of the initial curve. Instead of the calculation of the local curvature K and the simultaneous numeric integration of Eqs. (1) and (8), the Monte Carlo Simulation can be used to determine the temporal development of the curve length. |
| [Mullins 1956] | W.W. Mullins: Jour. Appl. Phys. 27; 1956 |
| [Zöllner (2006)] | D. Zöllner. Monte Carlo Potts Model Simulation and Statistical Mean-Field Theory of Normal Grain Growth. Shaker-Verlag, Aachen, 2006. |
Datenschutzerklärung der Otto-von-Guericke-Universität Magdeburg nach DSGVO